Mount Mokoto
- Prominence
- 542 m1,778 ft
- Isolation
- 28 km
- Tonight
- -7°CCloudy · Wind 28 km/h SE
Mount Mokoto is a 1,000 m (3,281 ft) volcano in Hokkaido, Japan.
All facts
- Elevation
- 1,000 m · 3,281 ft
- Nearest higher peak
- Mount Shibetsu (1,061 m)
- Region
- Hokkaido, Japan
- Coordinates
- 43.7043° N, 144.3310° E
Mount Mokoto 3D map
Drag to orbit · click, then scroll to zoom (or Ctrl/⌘ + scroll) · One finger scrolls the page · two fingers orbit and zoom · 10 × 10 km
Mount Mokoto terrain and contours
50 m contours from the Copernicus GLO-30 terrain model. Click two points on the map to draw your own cross-section.Tap two points on the map to draw your own cross-section.
Mount Mokoto elevation profile
West → east through the summit
Mount Mokoto weather
Today · Fair · -7 / -1°C (19 / 30°F) · Wind 28 km/h SE
Mount Mokoto forecast for the summit, about 1,000 m. Summit vs base: the Base line is for about 121 m.
- Today-7°-1°–28 km/h SEBase -2 / 5°
- Tue-8°2°13.3 mm32 km/h SBase -3 / 7°
- Wed-10°-6°–30 km/h WBase -4 / -1°
- Thu-6°-1°1.8 mm17 km/h SBase 0 / 4°
- Fri-1°3°–19 km/h SBase 4 / 8°
- Sat-5°6°0.9 mm23 km/h SWBase 0 / 11°
- Sun-6°-4°0.2 mm10 km/h SBase -1 / 2°
- Mon-6°0°0.1 mm9 km/h WBase -1 / 5°
- Tue-3°5°1.9 mm18 km/h SBase 2 / 10°
Forecast data: MET Norway, CC BY 4.0; daily low and high, precipitation total and strongest wind from the hourly data, model run Nov 22, 19:17 UTC.
Slope
Share of the 10 × 10 km view by steepness, from the 30 m model.
Mostly gentle: 69% of the view is under 15°.
- Steeper than 30°
- 5.7% of the 100 km² view
- Relief in view
- 870 m low point 121 m
Land cover
ESA WorldCover 10 m classification of the same area.
Snow & ice means glaciers and year-round snow (a yearly average), not today’s snow cover.
Where Mount Mokoto sits
Nearby places
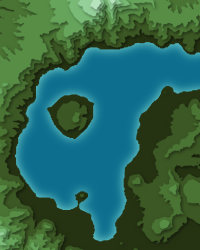
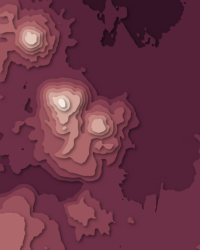
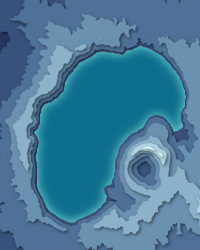
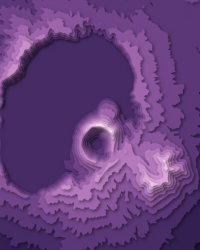
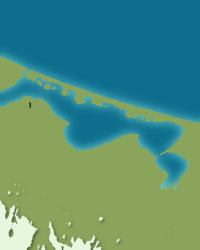
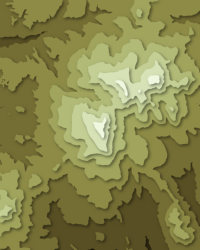
Mount Mokoto downloads: topographic map, heightmap, STL 3D model and DEM
Free files made in your browser from this page's terrain data. No sign-up; credit the sources below.
Print & wall
3D printing & 3D apps
GIS & GPS
Free to use with credit: see the data sources
How accurate is this?
within 10 m This 3D map reads 991 m at the summit; the official height is 1,000 m.
A 30 m terrain model averages each cell, so a few metres either way is normal.
| Source | Summit | Difference |
|---|---|---|
| Official height (Wikidata) | 1,000 m | — |
| Copernicus GLO-30 (used on this page) | 991 m | -9 m |
| Copernicus GLO-90 | 984 m | -16 m |
Data sources
- Terrain
- Produced using Copernicus WorldDEM-30 © DLR e.V. 2010-2014 and © Airbus Defence and Space GmbH 2014-2018 provided under COPERNICUS by the European Union and ESA; all rights reserved. The European Union, ESA, DLR and Airbus incur no liability for any use of this data and do not endorse this service.
- Imagery
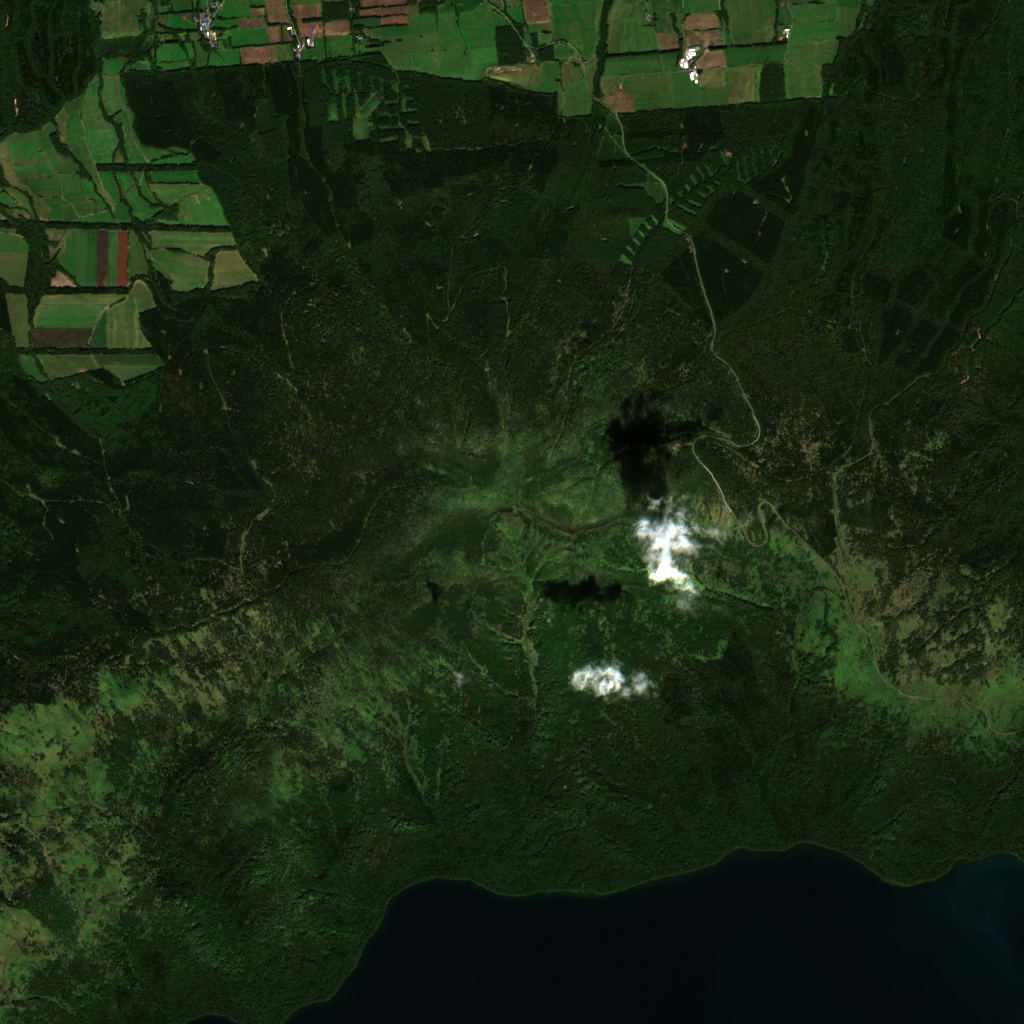
- Contains modified Copernicus Sentinel data 2026 (scene 2026-09-25)
- Land cover
- © ESA WorldCover project 2021 / Contains modified Copernicus Sentinel data (2021) processed by ESA WorldCover consortium
- Facts
- Wikidata (CC0)
- Summits
- © OpenStreetMap contributors, via Overture Maps Foundation (ODbL)
- Accuracy comparison, Panorama
- Includes Copernicus WorldDEM-90 © DLR e.V. 2010-2014 and © Airbus Defence and Space GmbH 2014-2018 provided under COPERNICUS by the European Union and ESA; all rights reserved. The European Union, ESA, DLR and Airbus incur no liability for any use of this data and do not endorse this service.
- Forecast
- Weather forecast from MET Norway (CC BY 4.0)
- Sources
- Wikidata · OpenStreetMap · GeoNames · Wikipedia